← worksCourse project · AI & Society202519/20
Missing Data Mechanisms and Imputation Strategies
Analyzing MCAR, MAR, and MNAR missing data mechanisms and benchmarking five imputation strategies on Iris and Wine.
Adriano Machado · Faculty of Sciences, University of Porto
This assignment explores the impact of different missing data mechanisms (MCAR, MAR, and MNAR) on model performance. Additionally, it evaluates the effectiveness of various strategies for addressing missing data.
1. Introduction
Missing data is a widespread problem in machine learning, significantly impacting the performance and reliability of predictive models. The absence of values in datasets can arise from various sources and mechanisms. Understanding the mechanism behind missing data is crucial, as it dictates the most appropriate strategies for mitigation. Missing data mechanisms can be categorized into three types:
- MCAR (Missing Completely At Random): Missingness occurs purely by chance.
- MAR (Missing At Random): The probability of missing data is related to the observed data but not to the missing variable itself.
- MNAR (Missing Not At Random): Is the most complex scenario where the probability of missing data is related to the missing variable itself or other unobserved data.
The objective is to analyze how these different missing data mechanisms influence potential mitigation strategies, ultimately impacting model performance and reliability.
2. Methodology
Using scikit-learn’s Iris and Wine datasets, we introduced missing data via the mdatagen library. Five imputation methods were tested: case deletion, mean imputation, MICE, KNN imputation, and SoftImpute.
To ensure a fair comparison of classification performance, we first determined the optimal Random Forest classifier hyperparameters for each complete dataset using GridSearchCV, maximizing the F1-score. These optimal models were then used consistently across all imputation strategies for each dataset.
The evaluation framework incorporated three key metrics:
- Predictive Accuracy (PAC): Measured using Mean Squared Error (MSE)
- Distributional Accuracy (DAC): Using the Kolmogorov-Smirnov Distance (KS Distance)
- Classification Error (CE): Evaluated indirectly by measuring the F1-score.
3. Results and Discussion
3.1. Missingness Patterns
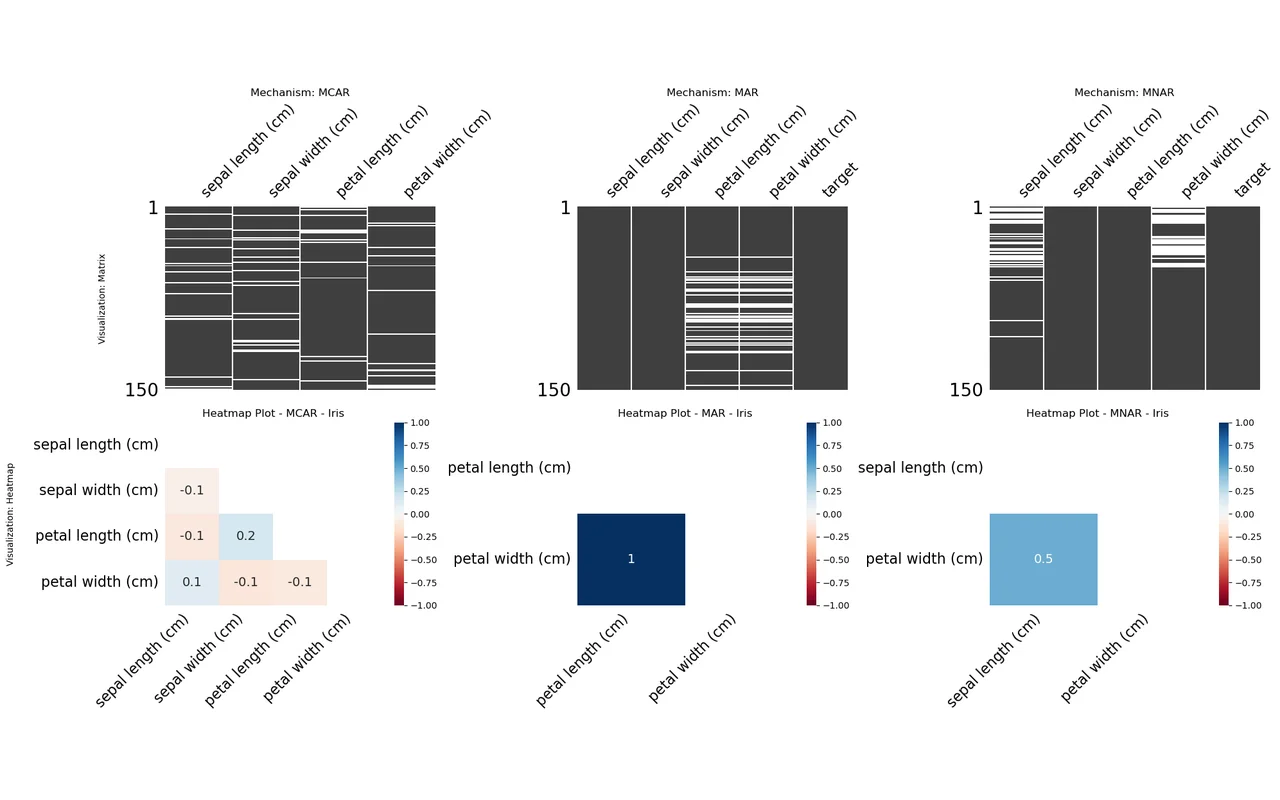
Using the mdatagen package, we generated three versions of each dataset with missing values under different mechanisms: MCAR, MAR, and MNAR. To visualize the missingness patterns, we used the missingno package to create matrix and heatmap plots. Due to space constraints, we’ll focus on the analysis of the missingness patterns in the Iris dataset.
- MCAR (1st Col): The missing values are randomly distributed across the dataset. There’s no visible patterns in the matrix and the heatmap contains no significant correlations.
- MAR (2nd Col): The missingness is related to other observed features in the dataset. In this case the petal-width is strongly correlated to the petal-length.
- MNAR (3rd Col): Petal width and sepal length are only moderately correlated, this is expected since it also depends on unobserved features.
3.2. Case Deletion
As anticipated, Case Deletion showed varying performance across missing mechanisms. For MCAR, while leading to some data loss, it still had reasonable F1-scores, particularly for the Wine dataset. However, under MAR case deletion resulted in a significant drop in F1-score for the wine dataset. This may be due to the biased removal of data where missingness is not entirely random, leading to a non-representative subset of data for model training.
3.3. Data Imputation
When examining MSE, Mean Imputation consistently showed the highest error and the lowest PAC, indicating a poor ability to accurately reproduce the original data values. KNN Imputation demonstrated a significantly higher MSE under the MNAR missing data mechanism. In contrast, MICE and SoftImpute consistently achieved lower MSE across all missing data mechanisms, with SoftImpute emerging as the best overall trade-off.
Regarding the Distributional Accuracy (DAC), Mean Imputation consistently shows the highest KS Distance, signifying a substantial deviation from the original data distributions. KNN Imputation preserves distributions under MCAR and MAR, however, under MNAR it performs poorly. MICE provides a middle-ground distributional accuracy, generally better than Mean Imputation but not consistently reaching the levels of KNN.
When analyzing classification performance, the F1-score is highest under the MCAR missing data mechanism, reflecting strong overall performance. For MAR, Mean Imputation and SoftImpute are the top performers, delivering the best F1-scores.
4. Conclusions
The main finding is that no single imputation method is universally optimal. The best approach is highly contingent on the nature of missingness (MCAR, MAR, MNAR), the specific dataset characteristics, and the intended goal (predictive accuracy, distributional similarity, or classification performance).
Case Deletion, while viable under MCAR, proved detrimental under MAR, emphasizing its sensitivity to non-random missingness.
Mean Imputation, while simple, consistently showed the lowest predictive and distributional accuracy, and often underperformed in classification tasks, indicating its limited utility.
KNN Imputation demonstrated good performance in preserving distributions under simpler mechanisms (MCAR, MAR), but struggled under MNAR in terms of predictive and distributional accuracy. MICE and SoftImpute emerged as robust all-around performers, consistently providing a good balance across PAC, DAC, and CE metrics and across different missing mechanisms. SoftImpute often showed a slight edge in predictive accuracy, while MICE provided robust distributional and classification performance.
In conclusion, the selection of a missing data strategy should be carefully considered, taking into account the suspected missing mechanism and the primary objective of the analysis. For scenarios prioritizing data fidelity and robust performance across diverse missingness, MICE and SoftImpute offer compelling options.
References
[1] Stef van Buuren. Flexible Imputation of Missing Data. Second Edition. Chapman and Hall/CRC, 2018. Accessed January 25, 2025. https://stefvanbuuren.name/fimd/sec-MCAR.html
[2] YData AI. "Understanding Missing Data Mechanisms: Types and Implications." July 27, 2023. Accessed January 25, 2025. https://ydata.ai/resources/understanding-missing-data-mechanisms
[3] Miriam Seoane Santos, Ricardo Cardoso Pereira, Adriana Fonseca Costa, Jastin Pompeu Soares, João Santos, and Pedro Henriques Abreu. "Generating synthetic missing data: A review by missing mechanism." IEEE Access 7 (2019): 11651-11667.
[4] Arthur Dantas Mangussi, Miriam Seoane Santos, Filipe Loyola Lopes, Ricardo Cardoso Pereira, Ana Carolina Lorena, and Pedro Henriques Abreu. mdatagen: A Python library for generating missing data. 2024. Accessed January 25, 2025. https://arthurmangussi.github.io/pymdatagen/
