← worksCourse project · AI & Society202420/20
Data Profiling of a Salary Survey Dataset
Data quality audit and demographic bias quantification across 28,000 AskAManager salary records.
Adriano Machado · Artificial Intelligence and Society, FEUP/FCUP
The AskAManager salary survey gathers self-reported compensation data from across the globe, but free-text inputs and voluntary participation introduce severe structural skew. Auditing its 28,085 responses revealed three main failure points: unconstrained country inputs fractured the United States across dozens of variations (artificially deflating its raw count from 23,039 down to 9,337), unvalidated salary strings introduced six-billion-dollar typographic artifacts alongside mixed foreign currencies, and extreme demographic imbalances (a 4:1 female-to-male ratio and 87% White respondents) mean unweighted models will simply memorize the compensation patterns of white American women.
Dataset schema & incompleteness profile
The survey dataset comprises 28,085 records across 18 features, capturing industry classifications, job titles, annual compensation, bonus pay, geographic locations, experience bands, education levels, and demographic identities.
Initial structural auditing confirmed 0 duplicate rows and 0 mixed-type columns, but revealed 86,795 missing cells across the table, an overall incompleteness rate of 17.2%. Rather than uniform random noise, missingness concentrates entirely in optional and conditional survey fields:
| Feature | Data Type | Missing (%) | Survey Context & Mechanism |
|---|---|---|---|
| timestamp | datetime64 | 0.00% | Mandatory submission timestamp |
| age | categorical | 0.00% | Mandatory age bracket |
| industry | categorical | 0.26% | 72 unclassified submissions |
| job_title | string (free-text) | 0.00% | Mandatory primary title |
| job_context | string (free-text) | 74.12% | Optional qualifier for non-standard roles |
| annual_salary | string (uncleaned) | 0.00% | Mandatory compensation field |
| additional_compensation | numeric | 26.01% | Optional; applicable only if bonuses/overtime received |
| currency | categorical | 0.00% | Predefined currency dropdown with 'Other' option |
| other_currency | string (free-text) | 99.26% | Conditional; only filled when currency is 'Other' |
| income_context | string (free-text) | 89.16% | Optional explanation of compensation structure |
| country | string (free-text) | 0.00% | Mandatory unvalidated text field |
| state | categorical | 17.90% | Conditional; applicable exclusively to US respondents |
| city | string (free-text) | 0.29% | Optional municipal identifier |
| total_experience | categorical | 0.00% | Mandatory cumulative career bracket |
| field_experience | categorical | 0.00% | Mandatory field-specific tenure bracket |
| education_level | categorical | 0.79% | Optional highest degree obtained |
| gender | categorical | 0.61% | Optional demographic identifier |
| race | string (multi-select) | 0.63% | Optional multi-selection race identifier |
Core professional and monetary attributes (job_title, annual_salary, currency, country, total_experience, field_experience) have 0% missingness. High-missingness columns (job_context at 74.12%, income_context at 89.16%, other_currency at 99.26%) represent legitimate skip-logic rather than data loss. The 17.90% missingness in state matches the non-US respondent share, validating that geographic branching operated as intended.
Open-text fragility & country normalization
Allowing respondents to provide unconstrained free text for structured fields introduces substantial fragmentation. Without dropdown validation or canonical gazetteers, variations in casing, punctuation, abbreviations, trailing whitespace, and emojis splinter single entities into hundreds of distinct categories.
This vulnerability was most severe in the country column. In the raw dataset, the United States appeared under more than 10 different textual representations:
- Exact strings:
"United States","USA","US","U.S.","America","united states","united states of america" - Punctuation & case variants:
"u.s.a.","u.s.","Usa","the us","the united states" - Typographical errors:
"united states of american","united state" - Unicode artifacts:
"🇺🇸" - Whitespace trailing entries:
"United States "(684 occurrences),"USA "(468 occurrences),"US "(63 occurrences)
In raw frequency tables, "United States" accounted for only 9,337 entries. Naive geographical grouping would drastically misrepresent the survey's national composition.
A text normalization routine (stripping whitespace, lowercasing tokens, and applying canonical mapping dictionaries) consolidated these fragments. The standardized count for the United States increased from 9,337 to 23,039 entries.
| Rank | Country | Raw Recorded Count | Normalized Count | Dataset Share (%) |
|---|---|---|---|---|
| 1 | United States | 9,337 (exact) | 23,039 | 82.04% |
| 2 | Canada | 1,570 | 1,678 | 5.97% |
| 3 | United Kingdom | 547 | 1,325 | 4.72% |
| 4 | Australia | 332 | 389 | 1.38% |
| 5 | Germany | 172 | 195 | 0.69% |
| 6 | Ireland | 109 | 125 | 0.45% |
| 7 | New Zealand | 101 | 123 | 0.44% |
| 8 | France | 57 | 68 | 0.24% |
| 9 | Netherlands | 48 | 57 | 0.20% |
| 10 | Spain | 41 | 49 | 0.17% |
Normalizing country entries proved that the dataset is overwhelmingly Western and US-centric. A predictive model trained on the raw categories would treat "USA" and "United States" as separate labor markets, diluting statistical power and corrupting regional salary benchmarks.
Monetary formatting & scale anomalies
The annual_salary column accepted free-text input rather than strictly validated numeric figures. As a result, 72.29% of entries (20,302 rows) included thousand-separators (commas), while 27.71% (7,783 rows) were entered as plain digit sequences or contained decimal points.
Direct numeric conversion fails without preprocessing. Stripping commas and parsing the column as a 64-bit float revealed substantial distribution distortion:
| Metric | Raw Parsed Value | Cleaned Working Range | Interpretation |
|---|---|---|---|
| Count | 28,085 | 27,995 | 90 extreme/erroneous rows identified |
| Minimum | 0.00 | 10,000 | 18 respondents reported $0 annual compensation |
| 25th Percentile (Q1) | 54,000.00 | 54,000 | Lower quartile salary threshold |
| 50th Percentile (Median) | 75,000.00 | 75,000 | Robust central tendency measure |
| 75th Percentile (Q3) | 110,000.00 | 110,000 | Upper quartile salary threshold |
| Mean | 361,242.00 | 89,450 | Inflated by 400% due to unclipped extreme outliers |
| Standard Deviation | 36,207,920.00 | 58,320 | Heavily distorted by billion-scale entries |
| Maximum | 6,000,070,000.00 | 1,000,000 | Typographic entry error ($6B in CAD) |
Two distinct error mechanisms caused this distortion:
- Typographic concatenation errors: The maximum value in the dataset is 6,000,070,000 (row 28,055). The respondent is an 18-24 year-old Investment Banking Analyst in Toronto with one year of experience, reporting in Canadian Dollars (CAD). The entry represents a typo where base salary (
60,000) and expected bonus or ceiling (70,000) were concatenated without punctuation, turning a standard CAD $60k entry into a six-billion-dollar outlier. - Unstandardized foreign currencies: Respondents working outside North America frequently entered compensation in currencies with significantly higher nominal denominations without exchange rate conversion. For instance, row 11,454 reports an annual salary of 870,000,000, and row 18,984 reports 180,000,000; both are denominated in Indonesian Rupiah (IDR), corresponding to roughly $55,000 and $11,500 USD. Similarly, row 27,902 reports 120,000,000 in Colombian Pesos (COP, ~$30,000 USD).
Because the survey did not enforce a common baseline currency (such as purchasing power parity or USD conversion), raw numeric comparisons conflate nominal currency scales with true earning levels.
Categorical associations via Cramér's V
To evaluate inter-variable dependencies across non-numeric fields, an association analysis was conducted using Cramér's V. Based on Pearson's chi-square contingency statistic, Cramér's V measures association strength between nominal variables on a normalized scale from 0 (complete independence) to 1 (perfect association), incorporating the Bergsma-Wicher bias correction for table dimensions:
V = sqrt( φ̃² / min(r̃ - 1, k̃ - 1) )
The association matrix reveals clear groupings across the 18 features:
- Strong associations (
V > 0.70):currencyandcountry(V = 0.90): Natural geographic clustering where national borders dictate legal tender.currencyandcity(V = 0.83): Municipal locations track their respective national currency regimes.job_contextandincome_context(V = 0.74): Strong alignment between qualitative role descriptions and supplementary income explanations, indicating that non-traditional compensation structures require explanatory text in both fields.
- Moderate associations (
0.40 ≤ V ≤ 0.70):stateandcity(V = 0.67): Standard administrative hierarchy within US regional responses.other_currencyandincome_context(V = 0.66): Foreign or non-standard compensation correlates with textual clarifications.total_experienceandfield_experience(V = 0.53): Career tenure naturally correlates with domain-specific tenure.ageandtotal_experience(V = 0.51): Expected life-cycle career progression.
- Weak associations (
V < 0.40):genderandjob_title(V = 0.39): Moderate-to-weak segregation across formal job classifications.raceandjob_title(V = 0.27): Low structural alignment between racial identification and job labels.raceandannual_salary(V = 0.24): Weak correlation between racial identity and compensation brackets in the schema.genderandannual_salary(V ≈ 0.00): Negligible direct association in raw categorical bins.
The weak correlation between demographic attributes and professional variables shows that observed wage disparities in crowdsourced data are driven by external systemic factors rather than simple variable overlap within the survey schema.
Demographic imbalances & fairness risks
Profiling demographic features exposed severe representation imbalances across gender, racial, and geographic dimensions.
Gender skew
The gender distribution exhibits a pronounced asymmetry: women account for 21,376 responses (~76.1%), while men represent only 5,493 entries (~19.6%). Non-binary individuals comprise 746 entries (~2.66%), and 298 respondents preferred not to disclose.
This nearly 4:1 ratio is an inversion of standard tech and corporate survey baselines, directly reflecting the readership of AskAManager.org. Any predictive model trained directly on this data without sample weighting would disproportionately optimize for female career pathways, yielding unreliable predictions for male professionals.
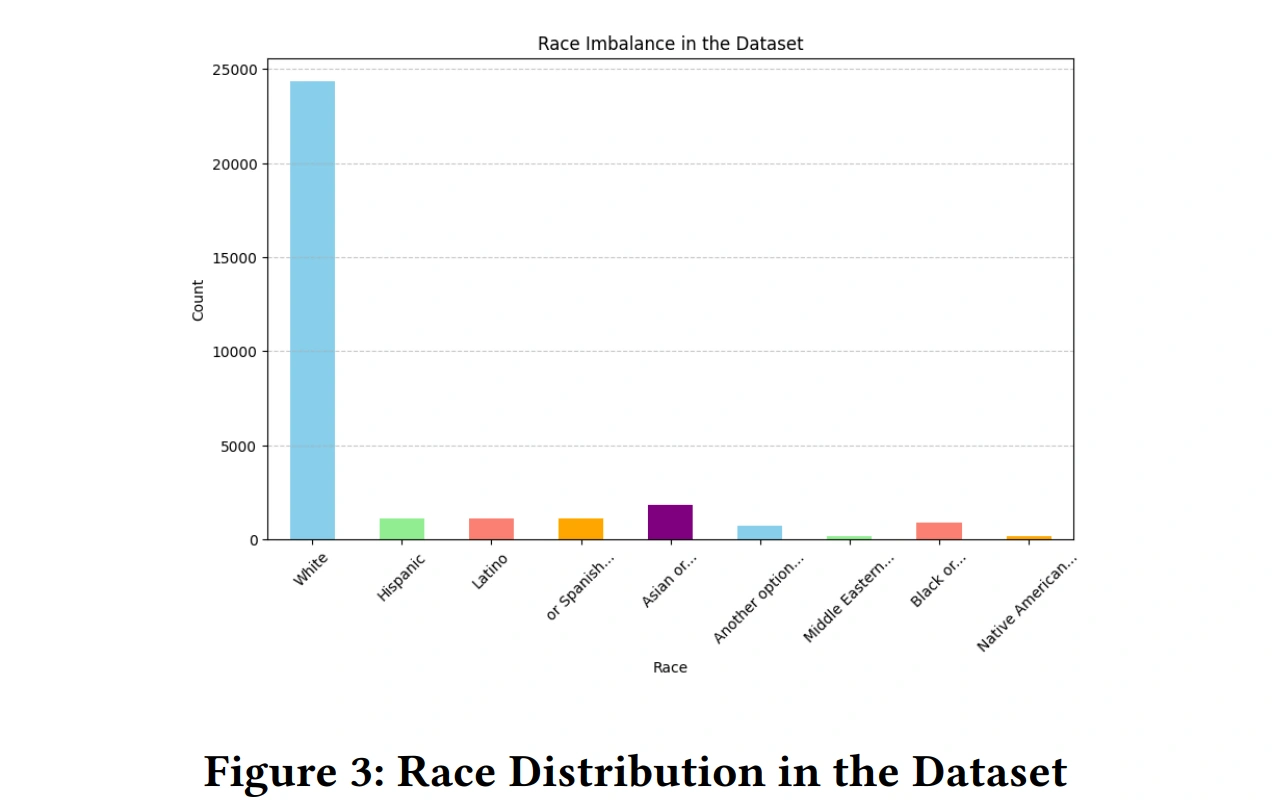
Racial overrepresentation
Because the race question permitted multi-selection ("Choose all that apply"), responses were parsed using a custom multi-label counter (split_and_count) that decomposed comma-separated strings to tally every racial identification independently:
| Racial / Ethnic Identity | Tally Count | Proportion of Respondents (%) |
|---|---|---|
| White | 24,372 | 86.78% |
| Asian or Asian American | 1,830 | 6.52% |
| Hispanic, Latino, or Spanish origin | 1,100 | 3.92% |
| Black or African American | 891 | 3.17% |
| Another option / prefer not to answer | 722 | 2.57% |
| Middle Eastern or Northern African | 180 | 0.64% |
| Native American or Alaska Native | 155 | 0.55% |
White respondents account for 24,372 entries (~86.8% of individuals). Minorities are severely underrepresented: Black or African American professionals represent only 3.17% (891 records), Middle Eastern or North African individuals constitute 0.64% (180 records), and Native Americans represent just 0.55% (155 records).
Intersectional risks for machine learning
Combining these demographic dimensions demonstrates that the AskAManager survey predominantly captures the economic reality of White, American women in professional roles.
Downstream machine learning models trained on this unadjusted sample face severe risks:
- Representational Harm: Underrepresented groups (such as Black men or Native American women) occupy tiny cell counts in cross-tabulations, leading to high prediction variance, wide confidence intervals, and systematic misestimation.
- Geographic Misgeneralization: With over 82% of responses originating in the US, applying models trained on this data to European, Asian, or Latin American markets produces biased compensation benchmarks that ignore local purchasing power, taxation, and statutory benefits.
Recommendations for downstream modeling
To ensure fairness, robustness, and data integrity before downstream modeling, four interventions are recommended:
- Deterministic Text Normalization: Replace raw open-text country and city entries with a rule-based normalization pipeline paired with ISO 3166-1 alpha-2 country codes and municipal gazetteers, preventing entity splitting.
- Currency Harmonization & Outlier Rejection: Convert all salary figures to a common currency benchmark (e.g., USD) using contemporaneous exchange rates mapped to the submission timestamp. Strip typographical artifacts using IQR-based bounds clipping (e.g., removing entries beyond 1.5 × IQR above Q3 or below statutory minimum wage).
- Stratified Sampling & Inverse Probability Weighting: Mitigate demographic skew by applying inverse probability weighting (IPW) during model training, weighting samples inversely to their joint demographic prevalence:
w_i = 1 / P(Gender = g_i, Race = r_i, Country = c_i). Weighting samples inversely to their demographic prevalence ensures that minority cohorts contribute proportionally to the model's loss gradient. - Dataset Nutrition Labels & Scope Limitations: Explicitly document the operational boundaries of models derived from this survey, specifying that inferences apply to US-centric, female-dominated professional cohorts and must not be used as uncalibrated global compensation baselines.
