← worksCourse project · AI & Society202420/20
Fetal Health Classification under Class Imbalance
Addressing class imbalance on the Fetal Health dataset through resampling methods and hard-voting ensemble models.
Adriano Machado · Faculty of Sciences, University of Porto
This study investigates the challenges associated with class imbalance in the Fetal Health Classification dataset. We explore techniques to address data imbalance and evaluate their impact on model performance, with particular emphasis on improving recall and F1-scores for minority classes.
1. The Dataset
The data analyzed in this study originates from the Fetal Health Classification dataset, which contains 2126 measurements of cardiotocogram (CTG) exams across 22 features. The goal is to develop a multiclass model capable of classifying these CTG features into three fetal health states: Normal, Suspect, and Pathological. Before addressing the data imbalance issue, we begin with an exploratory data profiling process. The complete data profiling is available in the jupyter notebook.
Starting with our target variable (Fetal Health) we identified a significant imbalance problem with 78% of the cases classified as Normal. The imbalance ratio shows that Normal cases occur 5.61 times more frequently than Suspect cases and 9.4 times more frequently than Pathological cases.
This class imbalance presents a significant challenge for classification models, as the relative scarcity of Suspect and Pathological cases may impact the model’s ability to identify these critical but infrequent conditions. To demonstrate this impact, we initially trained a logistic regression model and analyzed its performance through a classification report.
As we can see in Table I, eventhough the overall performance of the model looks good with a weighted average of 89% this can be misleading. As expected the model is performing poorly on decting the minority classes. While the recall for the majority class is about 94% the Suspect and Pathological classes have much smaller recall of 66% and 76% respectively.
| Class | precision | recall | f1-score | support |
|---|---|---|---|---|
| Normal | 0.94 | 0.94 | 0.94 | 333.0 |
| Suspect | 0.67 | 0.66 | 0.66 | 64.0 |
| Pathological | 0.79 | 0.76 | 0.77 | 29.0 |
| accuracy | 0.89 | 426.0 | ||
| macro avg | 0.80 | 0.79 | 0.79 | 426.0 |
| weighted avg | 0.89 | 0.89 | 0.89 | 426.0 |
TABLE I: Performance of Logistic Regression model on the original dataset
Our exploratory data analysis also analyzed the distribution of individual features relative to fetal health classifications. Due to space constraints, we only present the analysis of prolonged decelerations, which showed the highest correlation with the target variable. As illustrated in Figure 2, the strong correlation is evident, as almost all the cases exhibiting prolonged decelerations are classified as Pathological.
2. Addressing Class Imbalance
The selection of appropriate performance metrics is crucial before addressing the class imbalance issue. In the context of fetal health prediction, the consequences of failing to identify a Pathological or Suspect case (False Negative) are significantly more severe than misclassifying a Normal case as Suspect or Pathological (False Positive). This leads us to prioritize Recall (Sensitivity) as our primary performance metric. Complete disregard for false positives, however, may also carry problems, so we’ll consider the F1-score as our secondary evaluation metric.
There exist several techniques to address class imbalance:
- Data-level: (Re)Sampling Methods - Modify the (prior) distribution of the majority or/and the minority classes
- Algorithm-level: Learning methods are adapted to be more attuned to the class imbalance issue (e.g., weighting schemes, one-class classifiers).
- Cost-sensitive Level: Considers different misclassification costs for different classes.
- Feature Selection: Select an informative subset of features
- Ensembles: Aggregate the predictions of several classifiers
Our study primarily focuses on data-level techniques and ensemble methods. We evaluated several oversampling approaches: Random Over Sampling, SMOTE, BorderlineSMOTE, KMeansSMOTE, SvmSMOTE, ADASYN, and SMOTETomek.
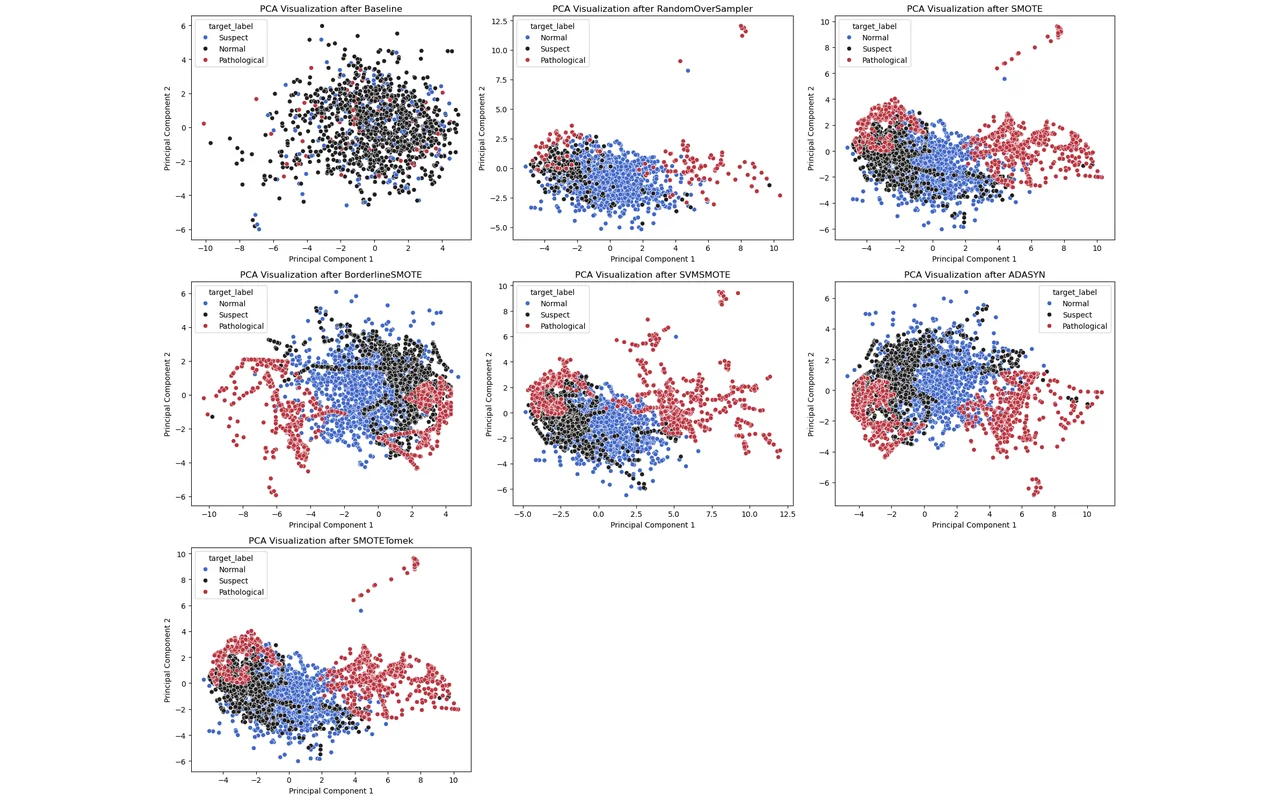
To visualize the impact these oversampling techniques have on our dataset, we used (PCA) to reduce the dimensionality of the feature space to two components, allowing for a 2D representation of the data before and after applying the resampling methods.
Figure 3 illustrates the effect of SMOTETomek oversampling on our dataset. The visualization reveals two significant improvements: first, the minority classes (Pathological and Suspect, shown in red and blue) achieve balanced representation; second, the decision boundaries between classes become more clearly defined.
We evaluated the impact of these techniques on Recall and F1-Score using three different classifiers: Logistic Regression, Random Forest, and Gradient Boosting. Among these, the Gradient Boosting classifier achieved the best results.
The application of resampling techniques significantly improved the Recall and F1-Score, for the minority classes. Figure 4 illustrated the performance of various resampling methods when used with a Gradient Boosting classifier. Among these, BorderlineSMOTE was the top-performing technique, achieving a recall of 0.91 for the Suspect class and 1.00 for the Pathological class. This represents a substantial improvement compared to the baseline Logistic Regression model (Recall: Suspect 0.66, Pathological 0.76). This is similar to the performance of the baseline meaning the accuracy of the model is not significantly affected by the sampling technique.
Furthermore, we developed an ensemble method combining Logistic Regression, Random Forest, and Gradient Boosting using hard voting on BorderlineSMOTE-processed data achieving exceptional results.
| Model | Dataset | Recall (Normal) | Recall (Suspect) | Recall (Pathological) | F1 (Normal) | F1 (Suspect) | F1 (Pathological) |
|---|---|---|---|---|---|---|---|
| Ensemble | Imbalanced | 98% | 76% | 93% | 97% | 83% | 93% |
| Ensemble | BorderlineSMOTE | 95% | 94% | 100% | 97% | 87% | 97% |
| Gradient Boosting | BorderlineSMOTE | 95% | 91% | 100% | 97% | 86% | 92% |
TABLE II: Performance comparison of ensemble and gradient boosting models with and without BorderlineSMOTE
As evident in Table II BorderlineSMOTE significantly improved both Recall and F1-Score for Suspect and Pathological classes, effectively addressing the imbalance issue. While the Normal class Recall decreased slightly compared to the imbalanced dataset, this trade-off is justified by the substantial improvements in minority class detection.
The ensemble method further enhanced performance, improving Suspect class Recall from 91% to 94% and Pathological class F1-Score from 92% to 97%.
References
[1] Handling Imbalanced Data for Classification - GeeksforGeeks, accessed January 5, 2025, https://www.geeksforgeeks.org/handling-imbalanced-data-for-classification/
[2] SMOTE for Imbalanced Classification with Python - MachineLearningMastery.com, accessed January 5, 2025, https://machinelearningmastery.com/smote-oversampling-for-imbalanced-classification/
[3] Le Quy, T., Roy, A., Iosifidis, V., Zhang, W., & Ntoutsi, E. (2022). A survey on datasets for fairness-aware machine learning. Wiley Interdisciplinary Reviews: Data Mining and Knowledge Discovery, 12(3), e1452.
[4] Fernández, A., García, S., Galar, M., Prati, R. C., Krawczyk, B., & Herrera, F. (2018). Learning from imbalanced data sets (Vol. 10, No. 2018). Cham: Springer.
[5] Kovács, G. (2019). Smote-variants: A python implementation of 85 minority oversampling techniques. Neurocomputing, 366, 352-354.
